Tutorial 1
Extend a set of microRNAs with target information
CyTargetLinker provides a quick and extensive enrichment of networks in Cytoscape. The visualization options allow biological interpretation of complex regulatory networks in a graphical way.
In this tutorial, a step-by-step explanation is given on how to extend a list of microRNAs with predicted and validated microRNA-target interactions (MTIs). The tutorial was created for the following versions:
- Cytoscape v3.7.1
- CyTargetLinker app v4.1.0
Step 1: Import a set of microRNAs into Cytoscape
First you will need to create a biological network in Cytoscape containing your microRNAs of interest. The datafile should contain at least two columns, (i) the microRNA name and (ii) the corresponding miRBase accession number. An example datafile, in which two microRNAs known to be involved in obesity are listed, can be downloaded from here (microRNA.xlsx).
- Open the datafile containing the microRNAs in Cytoscape via File -> Import -> Network from File. Select the downloaded microRNA.xlsx file.
- Specify the microRNA column as the Source Node (click on header and select green circle) and the miRBase ID as a Source Node Attribute (green data sheet), as shown in Figure 1.
- After clicking ‘OK’, you will receive the following warning: “No edges will be created in the network; the source column is not selected. Do you want to continue?”. Click ‘Yes’.
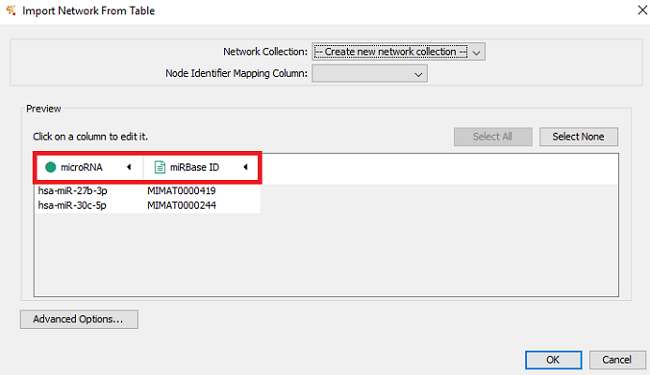 Figure 1 |
The resulting biological network of two microRNAs from the example data, as shown in Figure 2.
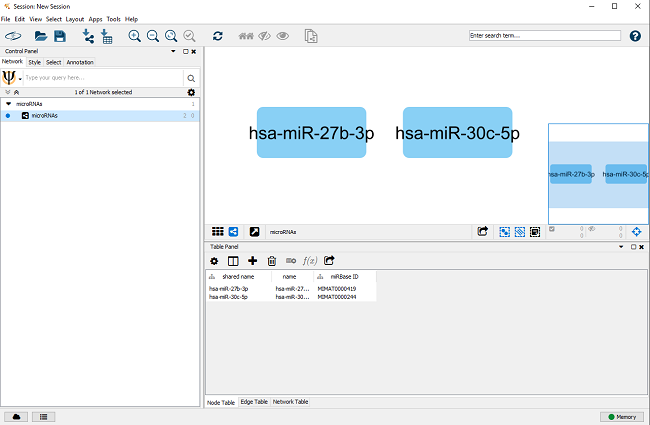 Figure 2 |
Step 2: Download MTI linksets
A linkset is a network containing additional information about and links between nodes in the network. This could be regulatory interactions like microRNA-gene interactions. The networks are stored in XGMML (the eXtensible Graph Markup and Modeling Language) format, which is supported by Cytoscape. Each linkset contains interactions consisting of two nodes, source and target, connected through one directed edge. Several linksets for different use cases, species and interaction types are provided on our website, see Figure 3. CyTargetLinker is not limited to the provided linksets. A user can also easily create their own linksets.
Before starting CyTargetLinker you need to download the linksets of interest and store them in a directory. In this example, we will use microRNA-gene interaction linksets from miRTarBase (validated interactions) and TargetScan (predicted interactions). For this tutorial, you can download a zip file containing both linksets from here.
- Download the zip file and unzip it so both xgmml files are in the tutorial1-linksets directory.
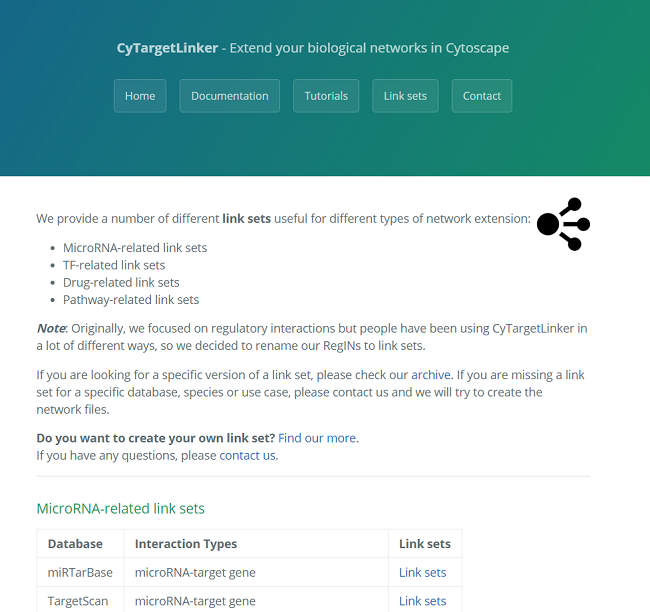 Figure 3 |
Step 3: Built regulatory network in Cytoscape
- Install the CyTargetLinker app via the app manager (Apps -> App Manager -> Select CyTargetLinker -> Click ‘Install’).
- Let’s start adding the known targets of the two microRNAs of interest.
- Go to ‘Apps -> CyTargetLinker -> Extend network’ (see Figure 4)
- Select the correct elements in the drop-down boxes for user network and network attribute. The user network is the network you want to extend. The network attribute is the column that is used to identify the entities in the linkset and needs to contain one of the supported identifiers. The MTI linksets support miRBase accession IDs, so we can select the miRBase ID column.
- Browse to the downloaded tutorial1-linksets directory to select the linksets used for extension.
- Select ‘TARGET’ as direction, indicating that you want to add target genes from the current microRNA nodes.
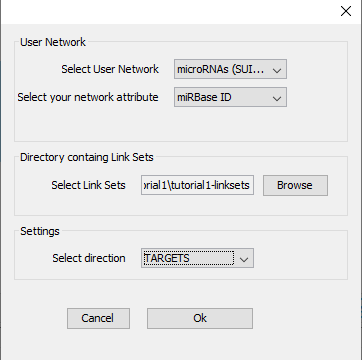 Figure 4 |
After clicking ‘OK’, you can select which of the linksets in the folder should be used - in this tutorial, we will use both available linksets in one extension step (Figure 5).
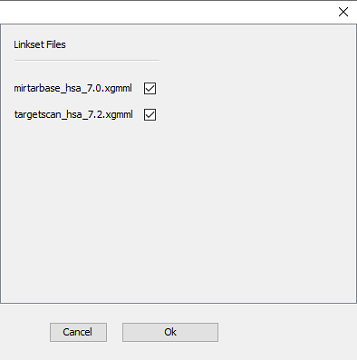 Figure 5 |
After the extension (this might take a little while depending on the size of the original network and linksets), the extended network is visualized in a new Cytoscape network, as shown in Figure 6. Go to ‘Apps -> CyTargetLinker -> Show result panel’ to see how many interactions are added from which linkset. A pop-up box appears that says Show/hide Result Panel. Make sure the box is checked and press ok. In the Results Panel, select CTL_microRNAs (SUID:94) from the drop-down box. For the current extension 942 edges from miRTarBase and 2,997 from TargetScan were added. The edge color indicates from which linkset the interaction was added (red for miRTarBase and blue for TargetScan).
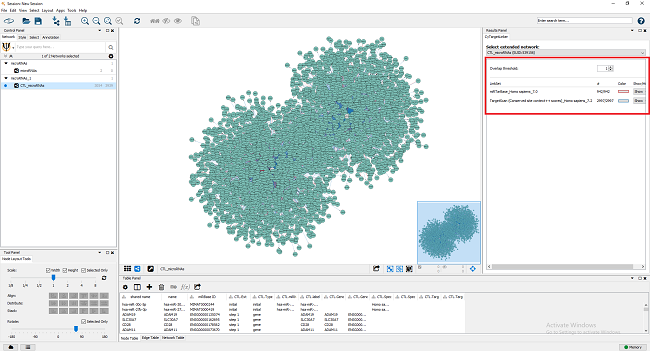 Figure 6 |
Since the default layout (forced-directed) is not ideal for this specific extended network, you can try other layouts (e.g. the yFiles organic layout, see Figure 7) by clicking Layout -> yFiles Organic Layout. This gives you a better idea about how many shared targets the two microRNAs have.
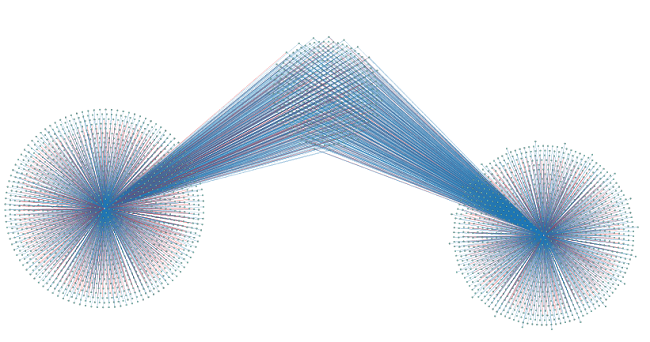 Figure 7 |
Step 4: Adapt visualization options
At any point you can hide certain link sets by using the ‘Show/Hide’ dropdown box in the results panel. You can also change the edge color used for a specific link set in this panel.
A very useful feature for large networks with multiple link sets containing the same interaction type is the ‘Overlap threshold’ functionality. If you select ‘2’, you will only see those interactions that are present in at least two link sets. If you try this in the tutorial network, you will only see 454 microRNA-gene relationships (two edges between each of them – one from each database, see Figure 8). Those interactions are the only ones present in both databases.
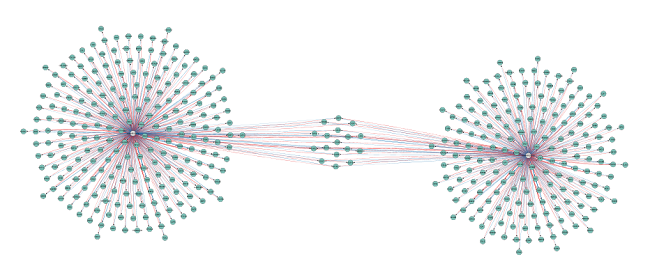 Figure 8 |